Profile Description And Example
When one creates profiles, based on standardized scores, you see what patterns people fit into. It is important to remember, however, that this is not an exact science. The number of different clusters found using profiles has varied by study. In a study conducted by Carlo DiClemente, Ph.D. and Sheryl Hughes (1990) with 224 participants entering outpatient alcohol treatment, 5 clusters were found:
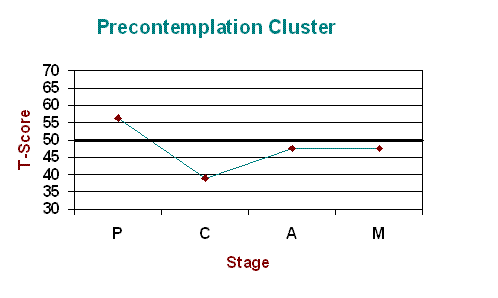 There were 63 individuals in the Precontemplation cluster. These participants appeared to be denying the existence of an alcohol problem, maintaining their alcohol problem and are not thinking about or engaging in any behavior change regarding their drinking.
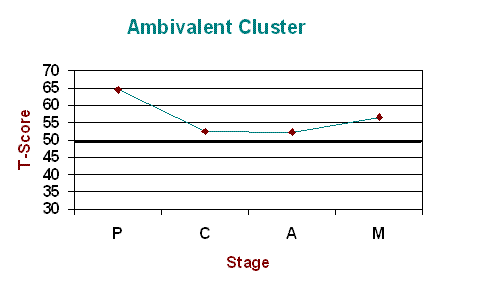 30 participants made up the Ambivalent cluster. These individuals appeared reluctant about changing alcohol-related behaviors and tended to report contradicting thoughts and behaviors.
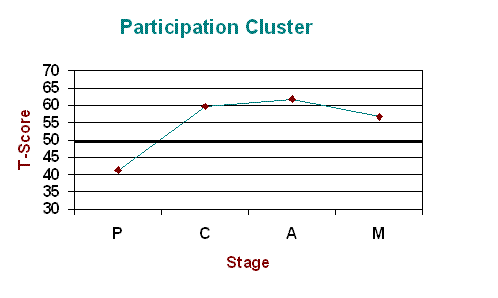 The 51 participants in the Participation cluster appeared to be invested and involved in alcohol-related behavior change.
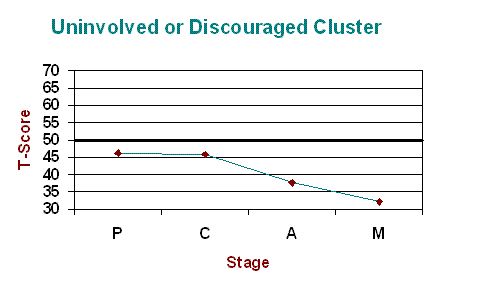 The 27 participants in the Uninvolved/Discouraged cluster are notable for having scores below the average for each of the stages. These people are not involved in behavior change and have lost hope for changing.
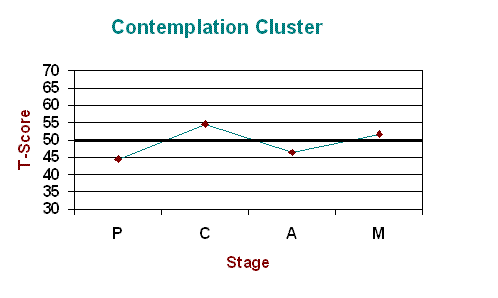 The 53 participants that made up the Contemplation cluster appear to have some serious thoughts about changing but have not yet started changing their behavior(s).
![]()
These five clusters were recreated in Project MATCH and ordered based on readiness for change:
| Uninvolved/Discouraged | Precontemplation | Ambivalent | Contemplation | Participation |
| Lowest Readiness | Highest Readiness |
Using The Template To Identify Participant Profile
If you have a sample of individuals that is similar to those used to create these profiles, you can use the template below to create individual profiles and compare them to these clustered groups. This will help you to understand where each individual’s readiness lies compared to others from different profile groups. If your sample is not similar (e.g. different substance used, different treatment setting, etc), you cannot be certain that these groups are appropriate for understanding readiness in your sample and you should either utilize the readiness score instead or run your own cluster analysis to identify how your sample groups look.
To obtain an individual’s Stage of Change profile, please circle the number in each column corresponding to the total scale score and connect with lines.
| T-Scores | PC | C | A | M |
| 100 | 30-35 | |||
| 95 | 29-30 | |||
| 90 | 27-28 | |||
| 85 | 25-26 | |||
| 80 | 23-24 | |||
| 75 | 21-22 | |||
| 70 | 19-20 | 35 | 35 | |
| 65 | 17-18 | 33-34 | 33-34 | |
| 60 | 15-16 | 34-35 | 31-32 | 31-32 |
| 55 | 13-14 | 33 | 29-30 | 28-29-30 |
| 50 | 11-12 | 31-32 | 27-28 | 26-27 |
| 45 | 09-10 | 30 | 25-26 | 23-24-25 |
| 40 | 07-08 | 28-29 | 23-24 | 21-22 |
| 35 | 27 | 21-22 | 18-19-20 | |
| 30 | 25-26 | 19-20 | 16-17 | |
| 25 | 24 | 17-18 | 13-14-15 | |
| 20 | 22-23 | 15-16 | 11-12 | |
| 15 | 21 | 13-14 | 08-09-10 | |
| 10 | 19-20 | 11-12 | 07 | |
| 5 | 18 | 09-10 | ||
| 00 | 16-17 | 07-08 | ||
| -05 | 15 | |||
| -10 | 13-14 | |||
| -15 | 07-12 |